Transparent reporting
These days, everything starts with data
Companies capable of collecting data and processing it intelligently will be able to transform their business and their industry.
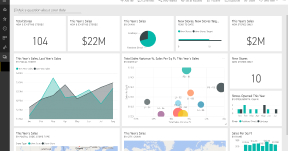

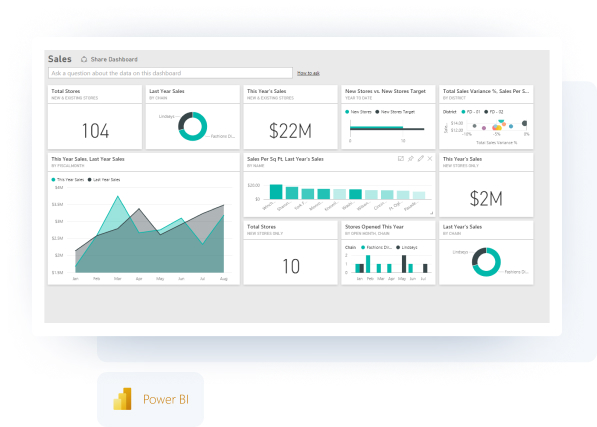
Clear presentation of data
Power BI reports provide an overview of operational data from several business areas on a single screen, divided into many different factors (dimensions). The possibility of monitoring data in the form of a multidimensional dashboard makes it easy to spot trends and deviations in the areas of interest.
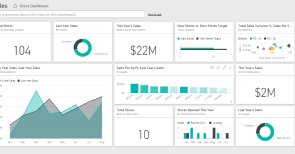
Report interactivity
Interactive form of Power BI reports fosters data analysis and quick drawing of conclusions.
The drill down (drill up) functions allow you to move seamlessly between different levels of detail in data hierarchy.
The drillthrough function allows you to move seamlessly between different aspects of the report, without having to recreate the filters used on each individual page of the report.
The Explain the increase/decrease function offers an insight into the roots of trends, whether it be a decrease or an increase in data, using a corresponding prior period as a reference point.

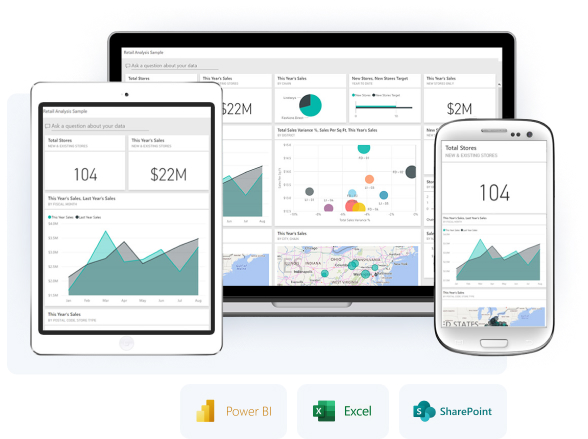

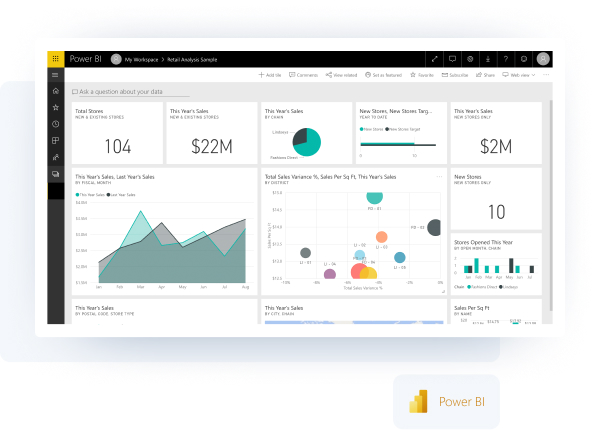
Easy to publish reports
Power BI is a revolutionary tool that enables you to visualise and analyse data in a way that feels extremely natural and intuitive. Functionality of reports with important indicators for the company increases provided that they can be easily published and shared.
A report prepared in Power BI is immediately saved in the cloud and is ready to be published both online and in the local environment from the very beginning. You can publish Power BI reports online and export them to Excel sheets, PowerPoint presentations or SharePoint sites. You also have the ability to embed reports into existing applications or websites.
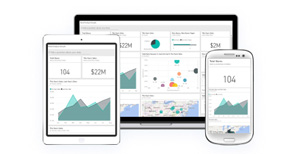
Power Bi reports are optimised for mobile devices & can be accessed through Android, iOS and Windows apps.